What the Data Says About Supervisor Behavior and Operational Outcomes


Every operational problem you’re managing right now was decided weeks ago.
The turnover showing up in this month’s numbers reflects coaching gaps from six weeks back. The safety incident nobody saw coming was preceded by a pattern of near-miss reports that stopped getting recognized. The throughput dip that triggered an emergency meeting was building since a handful of supervisors quietly stopped doing the small things that keep teams engaged.
By the time these show up in a report, they’re not predictions anymore. They’re history.
This is the structural limitation of every system most operations leaders rely on. HRIS records events after they happen. Performance management tools capture quarterly snapshots. Engagement surveys measure sentiment that’s already taken hold. None of them were built to capture the one variable that actually drives all three: what your supervisors are doing, day to day, in the moments nobody is formally tracking.
Supervisor behavior, not workforce demographics, not pay scale, not hiring quality, is the leading indicator of operational performance. And it’s measurable 30 to 60 days before it shows up anywhere else.
Why Supervisor Behavior Is the Variable Nobody Measures
Organizations spend significant resources measuring outcomes: production numbers, attendance rates, safety incidents, turnover percentages. These are the metrics that show up in board decks and quarterly reviews. They are also, without exception, lagging.
The Behavior-to-Outcome Sequence
Every operational outcome is the downstream result of a sequence of supervisor behaviors that occurred earlier. An employee doesn’t wake up one day and decide to quit. They experience weeks of declining recognition, sparse coaching, and growing invisibility before the decision crystallizes. A safety incident doesn’t happen in isolation. It’s preceded by near-misses that went unacknowledged and unsafe conditions that got flagged but never followed up on.
The sequence is consistent: behavior change happens first, engagement or risk shifts second, and the outcome shows up last. The gap between the first link in that chain and the last is where most organizations have zero visibility.
This is the core limitation of every system built around event tracking. HRIS captures the resignation. It cannot capture the six weeks of disengagement that preceded it because disengagement isn’t an event. It’s a pattern of behavior, both the employee’s and their supervisor’s, that develops gradually.
Why This Gap Persists
The reason this gap has persisted across the entire HR technology industry isn’t a lack of ambition. It’s that nobody built infrastructure to capture supervisor behavior at the source.
HRIS platforms were designed to track administrative events: clock-ins, payroll, terminations. Performance management tools were designed around quarterly review cycles built for office workers with stable, project-based work. Engagement surveys capture a snapshot of sentiment after the fact, filtered through whatever the employee is willing to disclose anonymously.
None of these systems were built to observe what a supervisor actually does between the start and end of their shift. Did they recognize someone today? Did they have a coaching conversation this week? Did they intervene on an attendance pattern before it became a documented absence? That data simply doesn’t exist anywhere because no system was capturing it at the point where it happens.
What the Data Actually Shows
When supervisor behavior is captured systematically, in real time, inside the supervisor’s actual workflow, the predictive relationship to operational outcomes becomes visible and quantifiable.
Recognition Cadence and Attendance
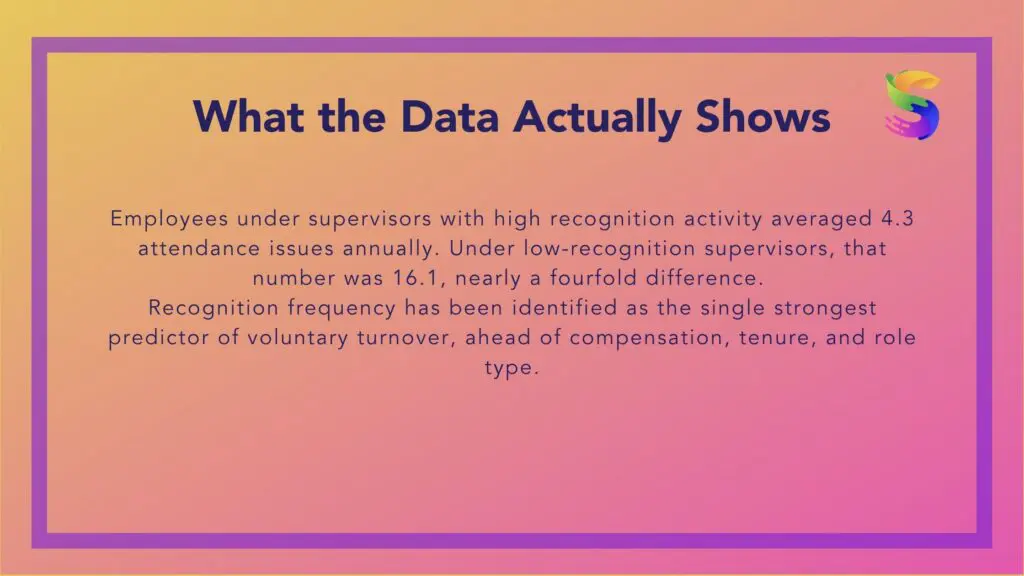
CFC’s data demonstrates this relationship with striking clarity. Employees working under supervisors with high recognition activity averaged 4.3 attendance issues annually. Employees working under supervisors with low recognition activity averaged 16.1. That’s nearly a fourfold difference, and it didn’t appear in attendance records first. It appeared in recognition behavior weeks before the attendance gap widened.
This means the attendance problem most organizations discover through HRIS thresholds was visible far earlier in supervisor behavior data. The supervisor whose recognition frequency had been dropping for three weeks was already producing the conditions for the attendance deterioration that wouldn’t register in a system until much later.
Recognition as the Leading Turnover Predictor
Buske’s regression analysis identified recognition frequency as the single strongest predictor of voluntary turnover, ahead of compensation, tenure, and role type. This finding reframes how organizations should think about retention risk entirely.
Most retention strategy is built around lagging indicators: exit interviews conducted after the decision is made, engagement surveys run annually or semi-annually, turnover rate calculated after the fact. If recognition frequency is the leading predictor, then the data that matters most is generated continuously, every day, by supervisor behavior, not captured periodically through surveys or interviews.
The Compounding Financial Impact
ASSA ABLOY’s experience translating supervisor behavior data into operational outcomes produced a 71% reduction in turnover and $1.1M in annualized savings. A third-party study of the same behavioral data found a 22.6% productivity improvement.
These numbers didn’t come from a new hiring strategy or a compensation overhaul. They came from giving leadership visibility into supervisor behavior early enough to intervene before problems compounded into costs. The financial impact is the outcome. The mechanism is behavioral data captured 30-60 days earlier than any existing system would have surfaced it.
The 30-60 Day Window Explained
Understanding why this window exists, and why it’s consistent across attendance, safety, and turnover, requires understanding what’s actually happening during that period.
What Happens in the Window
The 30-60 day window represents the time between a measurable shift in supervisor behavior and the point where that shift produces a documented, threshold-crossing event in traditional systems.
When a supervisor’s coaching frequency with a specific employee drops, that employee doesn’t immediately quit. They experience a period of declining engagement, reduced discretionary effort, and growing disconnection that develops over weeks. Eventually, that disengagement crosses a threshold and produces a resignation, an attendance pattern serious enough to trigger HRIS, or a safety lapse serious enough to generate an incident report.
During the entire window between the behavior shift and the threshold event, the organization has no visibility through any system except one that’s actually tracking supervisor behavior at the source.
Why the Window Is Consistent Across Outcome Types
The same 30-60 day pattern shows up whether the eventual outcome is turnover, a safety incident, or a throughput decline. This consistency suggests the window reflects something structural about how disengagement and risk accumulate in frontline environments, not something specific to any one metric.
Employees and teams don’t fail suddenly. They drift. The drift is driven by the accumulation or absence of specific supervisor behaviors: recognition, coaching, documentation, intervention. The window is the time it takes for that drift to become severe enough to register as a documented event.
What Becomes Possible Inside the Window
Organizations with visibility into the window can intervene while intervention is still relatively low-cost. A coaching conversation at Week 2 of a recognition gap costs almost nothing. A retention conversation after an employee has already accepted another offer costs the full price of replacement.
This is the strategic value of behavioral data: it doesn’t just predict the outcome, it creates the time and conditions necessary to change it.

Why Competitors Structurally Cannot Replicate This
The behavioral data advantage isn’t a feature gap that competitors can close with a product update. It’s an architectural difference rooted in what each category of system was built to capture.
HRIS Captures Events, Not Behavior
Workday, UKG, Paylocity, and ADP are excellent at what they were designed to do: track hours worked, process payroll, manage scheduling, and record exit events. These are administrative functions performed reliably and at scale.
None of this is behavioral data. An HRIS knows an employee clocked out for the last time. It has no mechanism for knowing whether their supervisor recognized their contributions in the preceding months, because recognition was never something the system was designed to observe.
Performance Management Tools Capture the Wrong Cadence
Lattice and 15Five are built around quarterly review cycles designed for office workers with goals that develop over months. Applied to frontline supervision, where problems emerge and compound on a daily and weekly basis, quarterly isn’t the cadence where frontline problems start or where they could be caught early.
Spreadsheets and Manual Tracking Capture Only What Gets Written Down
The most common alternative, supervisors manually tracking interactions in spreadsheets or relying on memory while walking the floor, captures whatever the supervisor happens to record. Most of it doesn’t get written down, not from negligence, but because documenting in the moment competes directly with the operational demands of the job.
The Architectural Difference
What makes Secchi’s data structurally unique is capturing supervisor behavior at the source, inside the supervisor’s actual workflow, in real time. Recognition cadence, coaching frequency, documentation consistency, attendance interventions, and communication patterns are recorded as a byproduct of the supervisor doing their job, not as a separate administrative task layered on top of it.
This is why the data exists at all. You cannot analyze data that was never collected, and no other system in the market is built to collect this category of data at this level of granularity.
What This Means for How Organizations Should Operate
If supervisor behavior predicts outcomes 30-60 days in advance, the operational implication is significant: organizations that can see this data have a structural advantage over organizations relying on lagging indicators alone.
From Reactive Management to Predictive Intervention
Most operations leadership currently operates in response mode. Turnover spikes, and the organization investigates after the fact. A safety incident occurs, and the response is corrective action and root cause analysis. Throughput drops, and leadership scrambles to identify the cause.
Behavioral data shifts this entirely. Instead of asking why turnover happened, leadership can ask which supervisors are showing declining recognition cadence this week, and intervene before the pattern produces a resignation. Instead of investigating after a safety incident, leadership can identify which teams have stopped generating near-miss reports and address the underlying disengagement before an incident occurs.
Supervisor Variance as a Leading KPI
Organizations that adopt behavioral data tracking gain a new category of operational KPI: supervisor variance. Not every supervisor manages their team with the same consistency, and that variance is currently invisible in most organizations because nothing measures it directly.
Once supervisor behavior is visible, leadership can identify which supervisors are driving above-average retention and engagement through consistent recognition and coaching, and which supervisors are quietly creating risk through inconsistency. This identification happens weeks before the outcome data would have surfaced the same pattern.
The Compounding Value of Early Visibility
Every week of additional visibility into supervisor behavior compounds the value of intervention. The earlier leadership sees a pattern, the lower the cost of addressing it and the higher the probability the intervention succeeds. Waiting for HRIS-threshold events means waiting until the cheapest intervention window has already closed.

Building the Case for Behavioral Measurement
Organizations evaluating whether to invest in supervisor behavior tracking should consider the asymmetry between the cost of the infrastructure and the cost of continuing to operate without it.
The Cost of Not Knowing
Every turnover event that could have been prevented with a coaching conversation 45 days earlier represents a cost that compounding behavioral visibility would have avoided. Every safety incident preceded by ignored near-miss reports represents a risk that recognition-driven behavior tracking would have surfaced in time to act.
These costs are not hypothetical. ASSA ABLOY’s $1.1M in annualized savings reflects the actual financial value of closing the visibility gap between supervisor behavior and operational outcomes.
The Case for Acting on Leading Indicators
Organizations already understand the value of leading indicators in other operational contexts. Manufacturing facilities track equipment vibration patterns to predict failures before they happen. Quality teams track defect rates at intermediate process steps rather than waiting for final inspection. The principle of intervening on leading indicators rather than waiting for lagging outcomes is well established everywhere except in how organizations manage their frontline leadership layer.
Supervisor behavior is the leading indicator for the people side of operations the same way vibration data is the leading indicator for equipment failure. The only reason it hasn’t been treated this way historically is that no system existed to capture it.
The Behavioral Layer Beneath Every Operational Outcome
Production numbers, attendance rates, safety records, and turnover percentages are the scoreboard. They tell you the result. They don’t tell you why, and by the time they move, the behaviors that caused the movement happened weeks earlier.
Supervisor behavior is the layer beneath the scoreboard: the recognition that didn’t happen, the coaching conversation that got skipped, the attendance pattern that went unaddressed. This layer determines what the scoreboard will say next quarter, and it’s measurable right now if you have the infrastructure to capture it.
Every system you currently have was built to record outcomes. None of them were built to capture the behaviors that create them. That’s the gap, and it’s the reason most organizations are always managing what already happened instead of what’s about to happen.
Ready to see the behavioral data that predicts your operational outcomes 30-60 days in advance? Explore how Secchi captures supervisor behavior at the source at secchi.io.
About Secchi: Secchi is the only system that captures supervisor behavior at the source. Organizations using Secchi see turnover, safety, and throughput risk 30-60 days before it shows up in the P&L, through recognition cadence, coaching frequency, and documentation consistency data that no other system collects.
Learn more at secchi.io.
Related Resources:
- What the Data Says About Supervisor Behavior and Operational Outcomes
- The Real Cost of a Bad Frontline Supervisor
- How to Measure Frontline Supervisor Effectiveness
- ROI Calculator: What Is Frontline Turnover Actually Costing You?
- Customer Case Studies: ASSA ABLOY, CFC
See how Secchi can drive positive change in your organization.
With Secchi, leaders across your entire organization have access to turn-by-turn leadership directions and actionable data that guides them on how to engage their teams through recognition, coaching, engagement, and accountability.
Want more leadership and engagement strategies straight to your inbox?
Subscribe here.